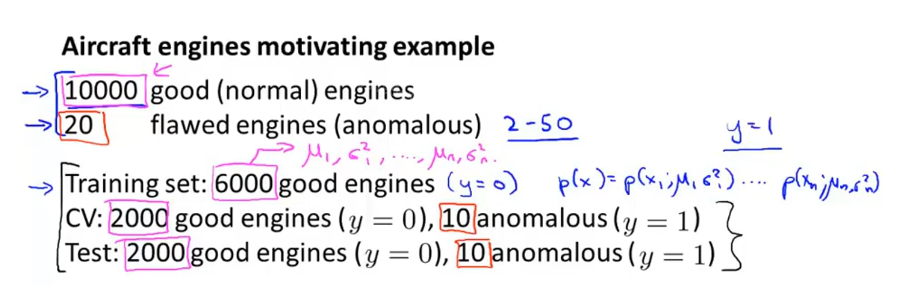
异常检测
给定样本,判断待测数据是否异常。
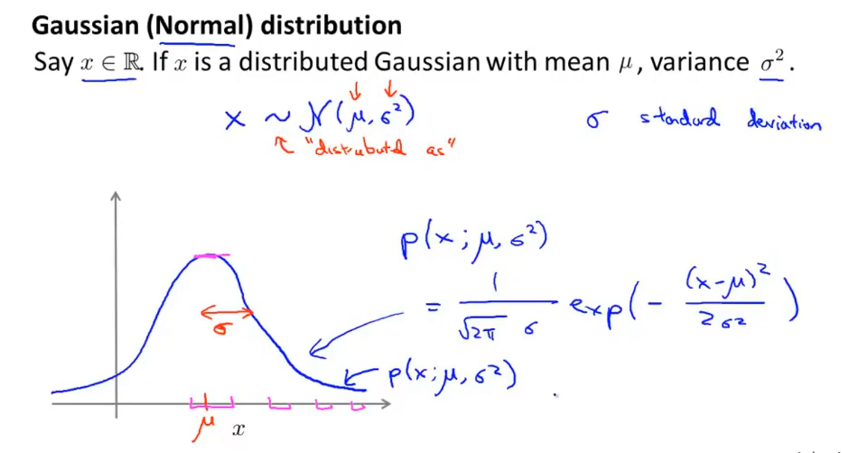
高斯分布
也称 正态分布,面积积分=1
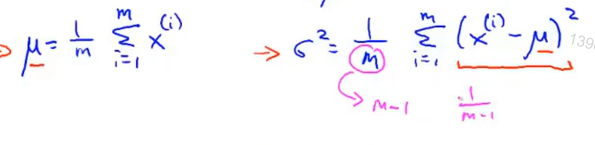
高斯分布的参数极大似然估计
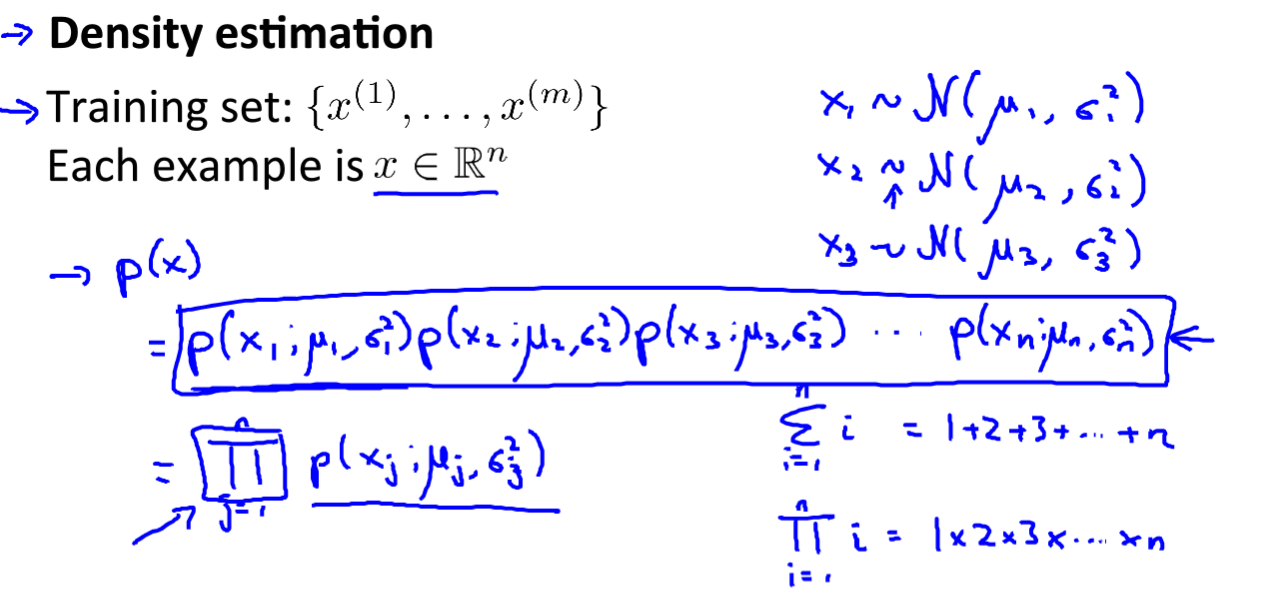
训练集中各特征量可以不是相互独立的
Π:对一系列数的乘积
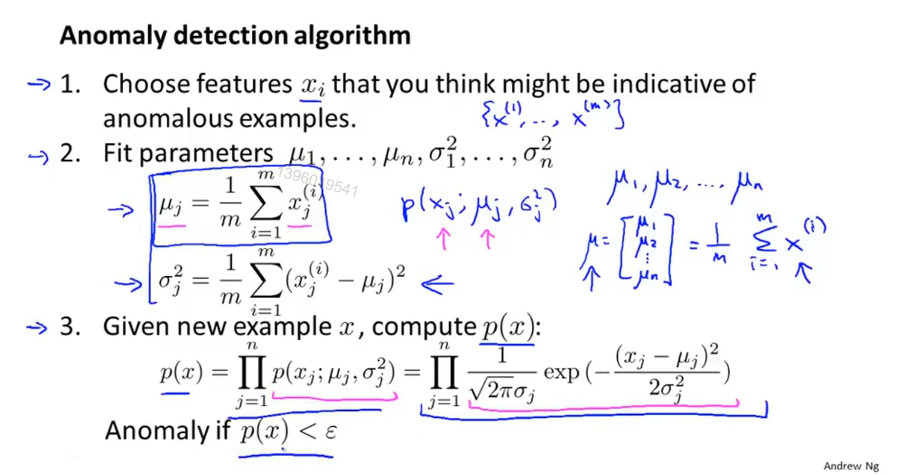
算法流程
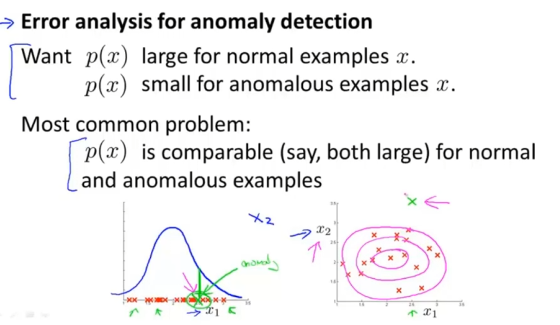
P(x)是对特征的建模
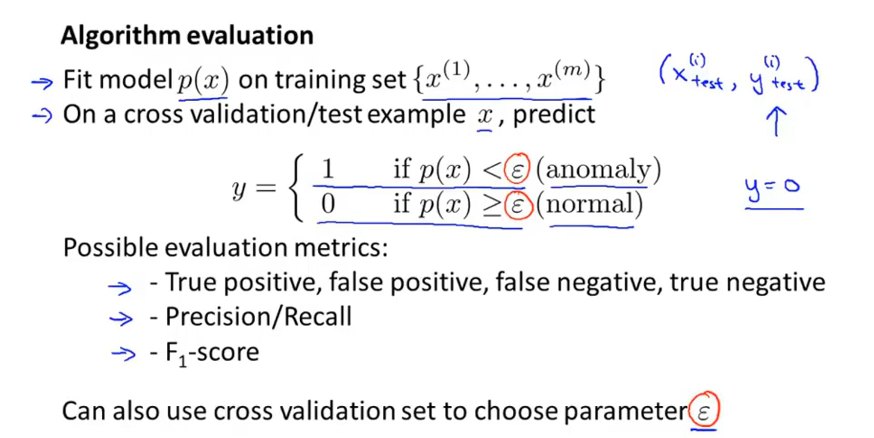
评估异常检测系统
用60%带标签的数据计算p(x),20%交叉验证集 20%测试集输出结果
然后计算准确率与召回率 ,F1从而评估异常检测系统
有点类似监督学习
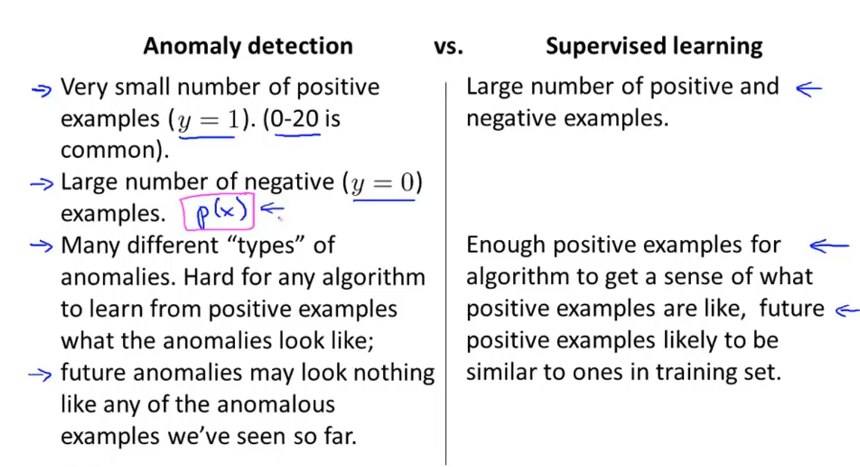
异常检测 vs 监督学习
1 是异常的 0 是正常的
可能之后的特征跟现在不一致
使用
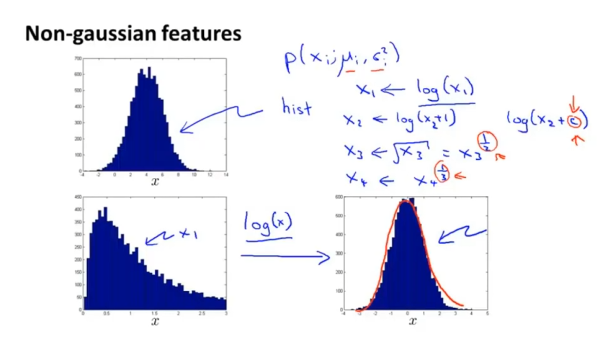
(1)转换非高斯分布特征
(2)误差分析,或添加新特征
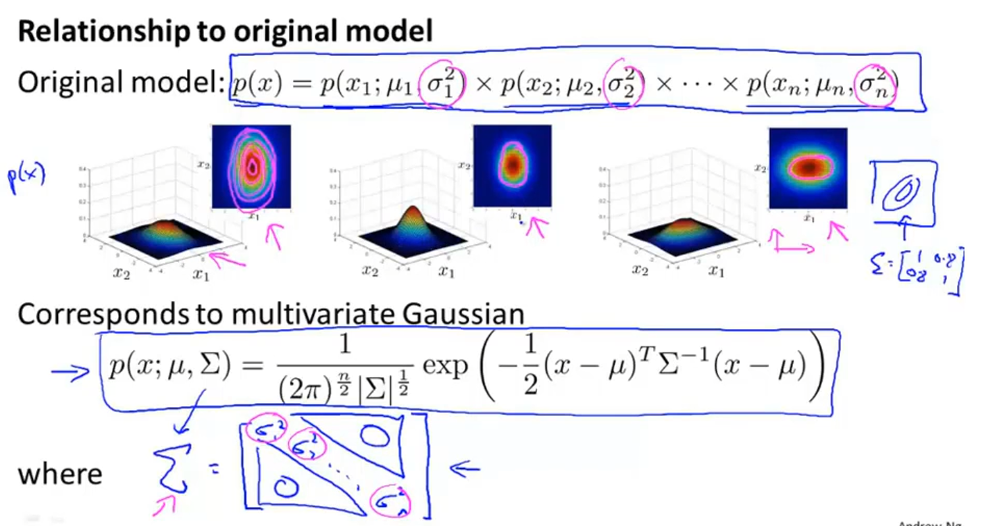
多高斯分布
Σ 协方差矩阵 可体现特征间的相关性
μ 均值 集中点(概率较大的位置)
运用
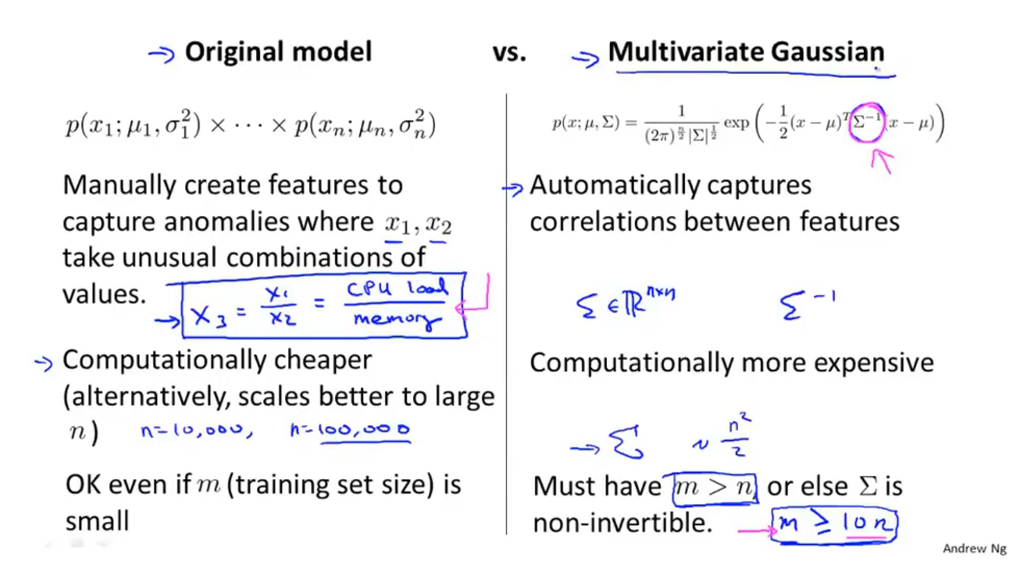
单高斯与多高斯之间的联系
多高斯分布能够自然地捕捉特征之间的关系
而单高斯分布计算量小,适应大规模计算
所以在m>n时用多高斯分布
tips: Σ 如果是奇异矩阵即不可逆,可能有两种情况:
(1)没有满足m>n的条件
(2)存在冗余特征(高度线性相关的特征、不包含额外信息)
编程作业
estimateGaussian.m
1 | function [mu sigma2] = estimateGaussian(X) |
selectThreshold.m
1 | function [bestEpsilon bestF1] = selectThreshold(yval, pval) |