在无监督学习中,数据都是不带任何标签的
通过算法发现数据中隐藏的结构从而找到分类簇或者其他形式
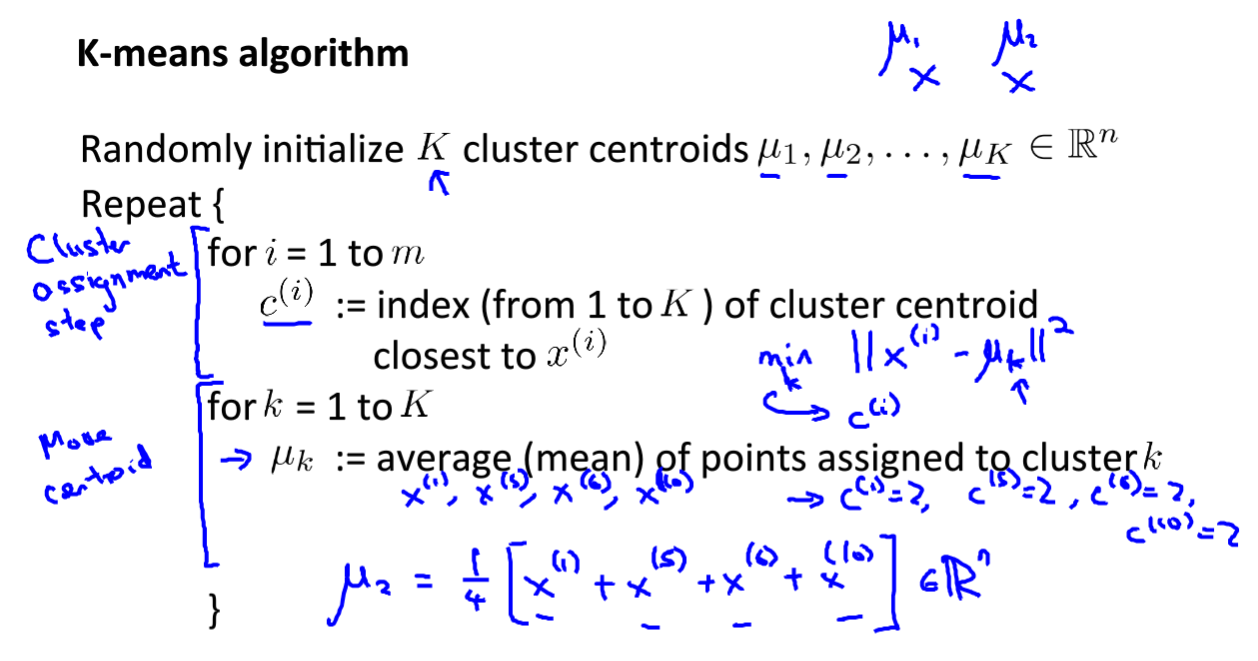
k-means聚类算法
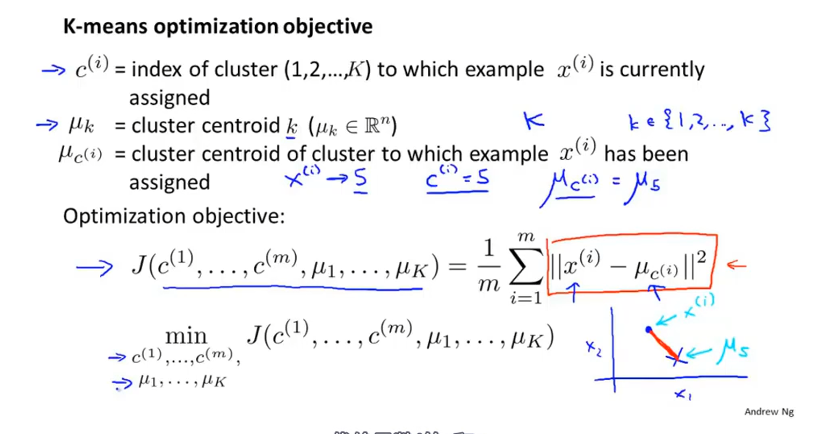
优化目标
J 也叫失真函数 ,畸变函数
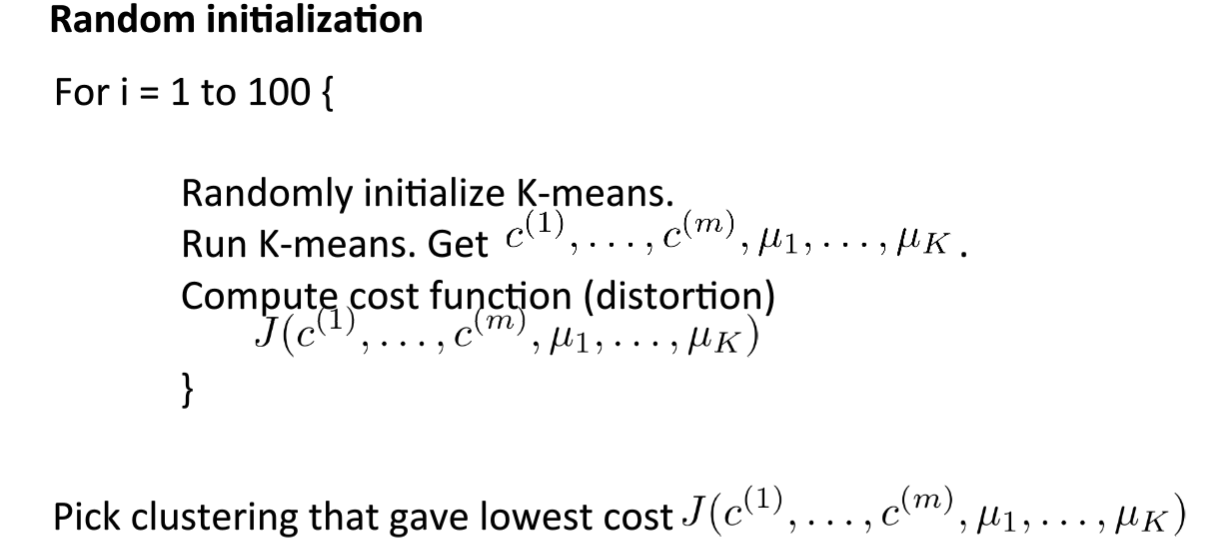
随机初始化
使得算法避免局部最优解
随机初始化状态不同,导致结果也不同,可能得到不好的局部最优。
使用多次随机初始化找到使得 J 最小的聚类中心
选取聚类数量
(1)手动选择
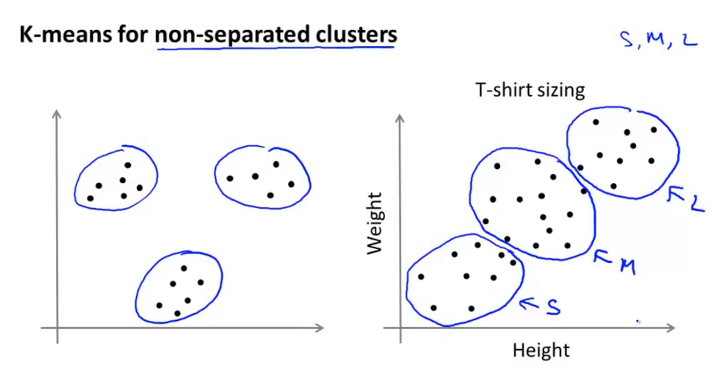
可视化数据,观察数据分离情况
(2)“肘部法则”
分别K = 1,2,3,4,5… 绘制 J 的曲线,选择拐点。但是有时很模糊~
(3)接下来数据的分类情况做一个评估
编程作业
pca.m
1 | function [U, S] = pca(X) |
projectData.m
1 | function Z = projectData(X, U, K) |
recoverData.m
1 | function X_rec = recoverData(Z, U, K) |
findClosestCentroids.m
1 | function idx = findClosestCentroids(X, centroids) |
computeCentroids.m
1 | function centroids = computeCentroids(X, idx, K) |
kMeansInitCentroids.m
1 | function centroids = kMeansInitCentroids(X, K) |